
CLIMATE MONITORING SERVICE
- Home
- CLIMATE MONITORING SERVICE
CLIMATE MONITORING SERVICE
| Product name | Short name | Description | Time period | Download |
|---|---|---|---|---|
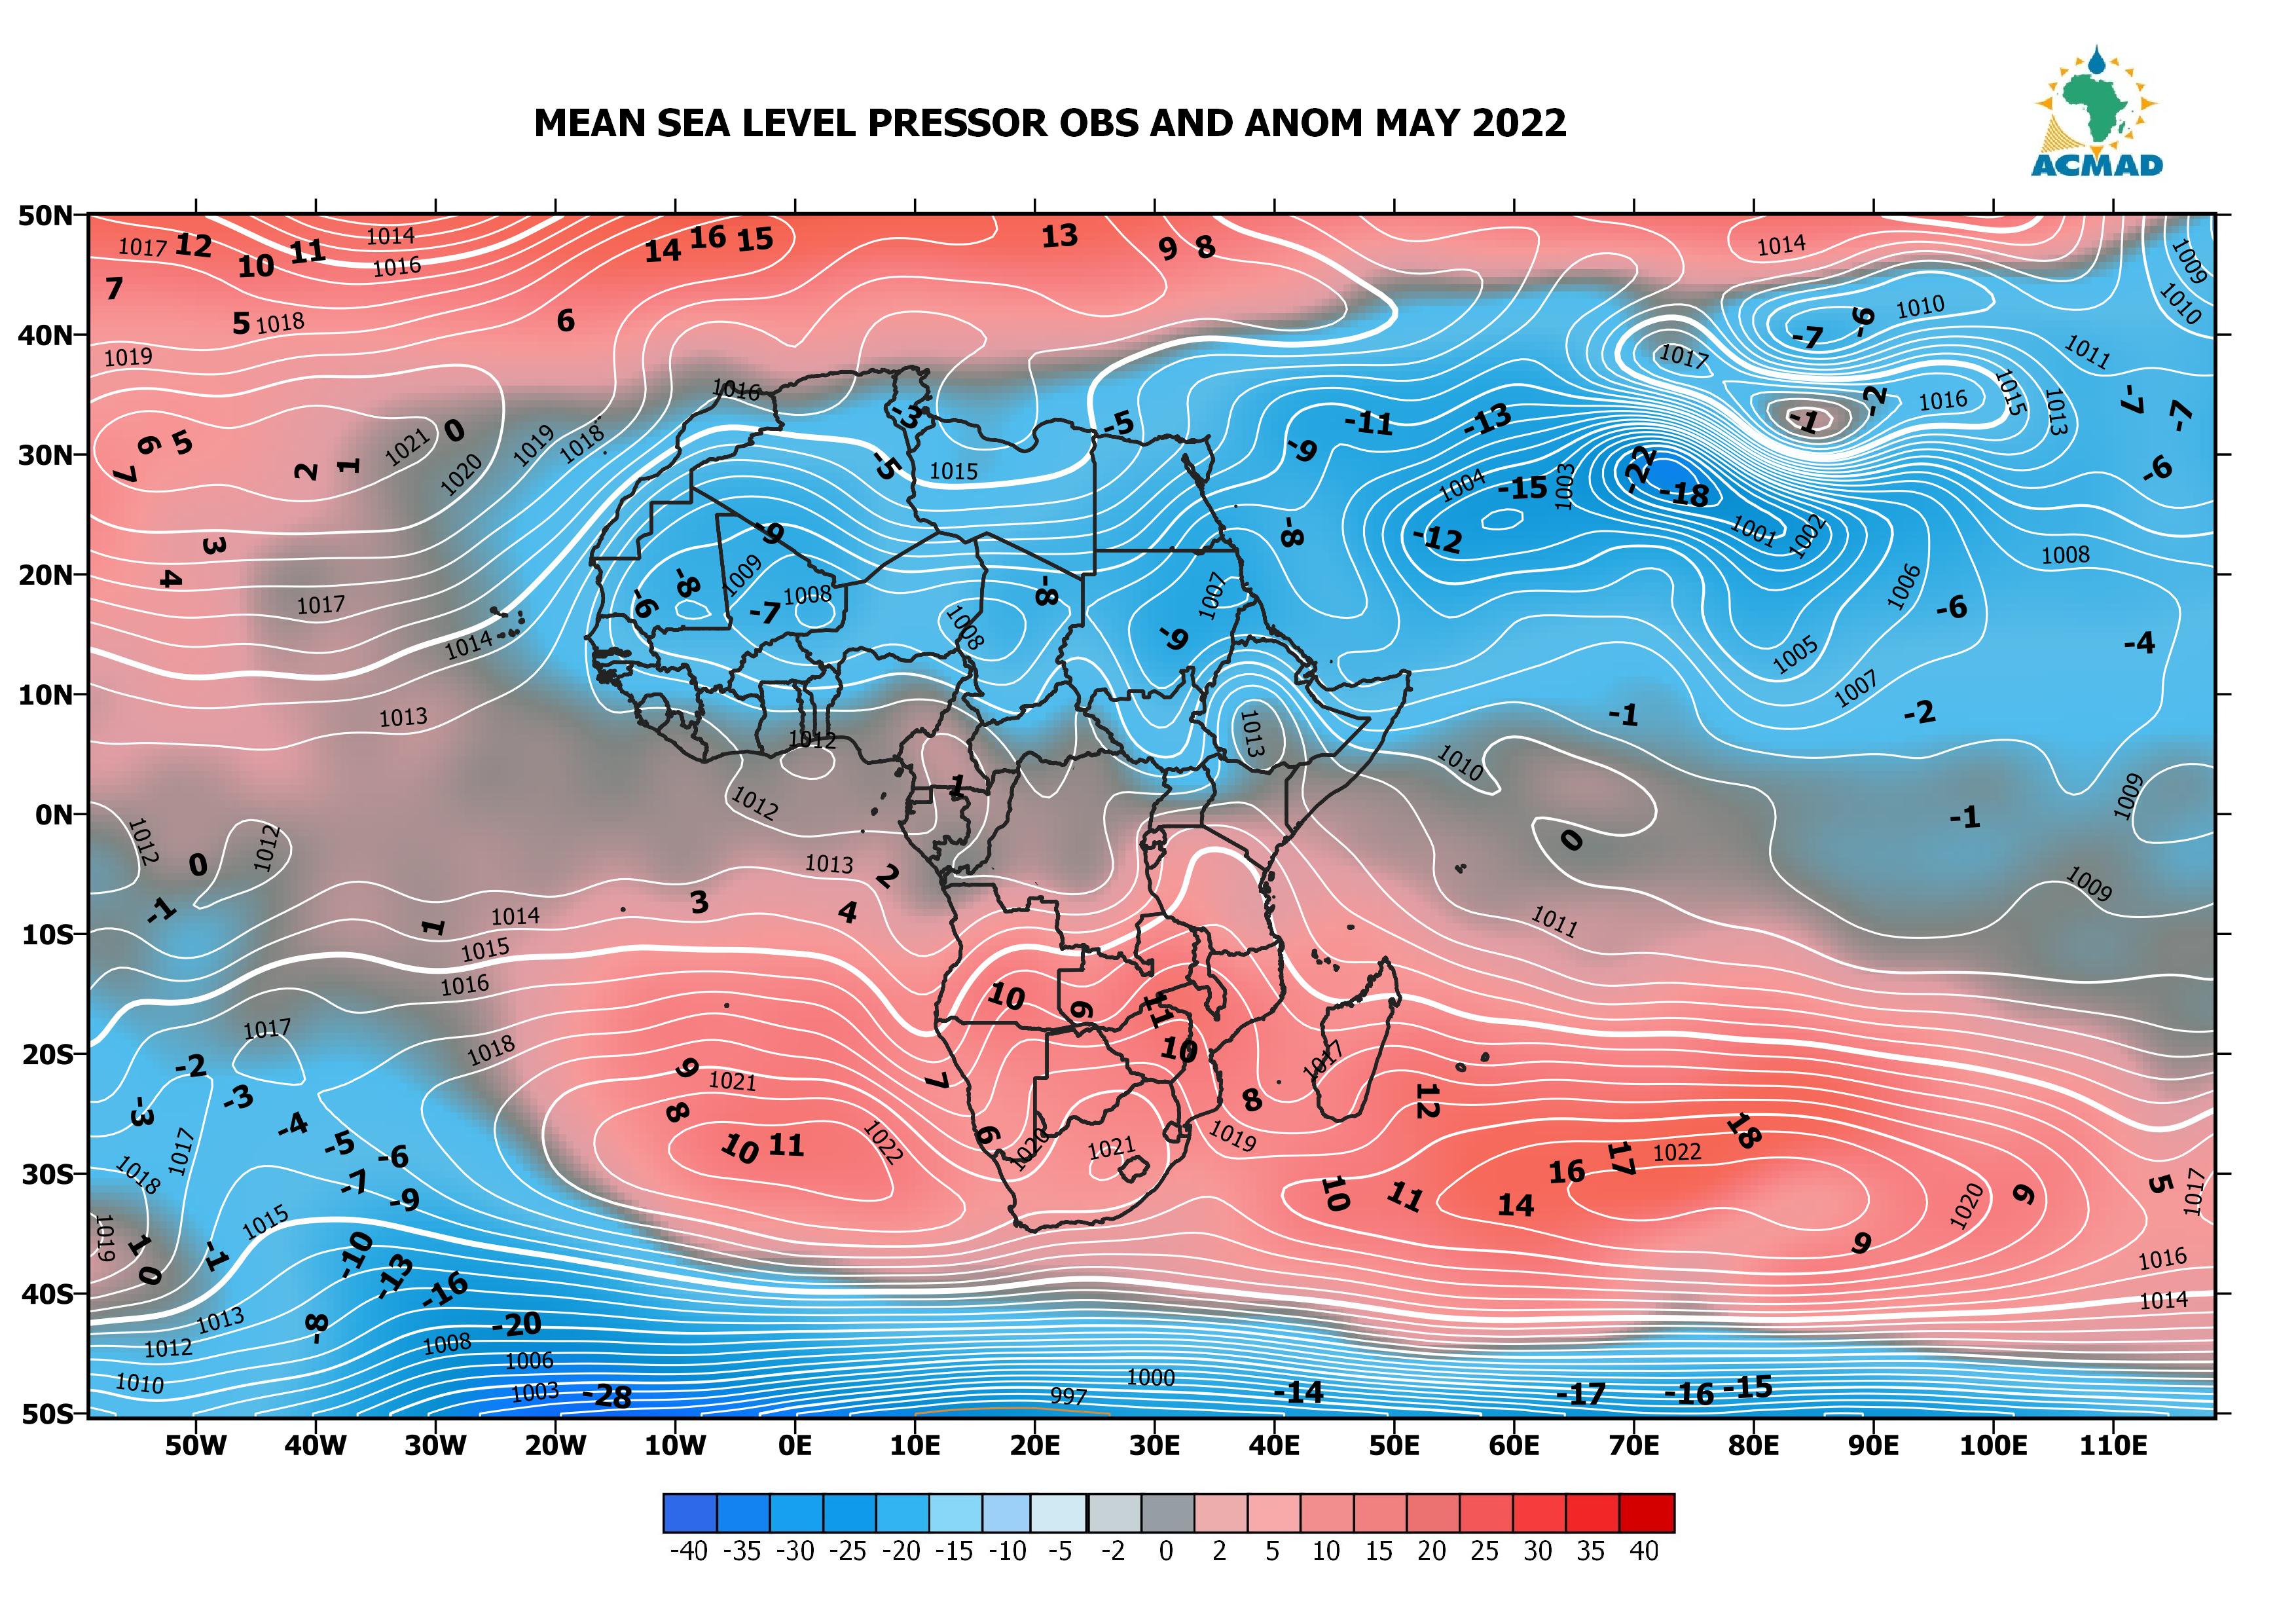
| Mean sea level pressure | MLSPM | This is a contour map of monthly average sea level pressure and anomalies for the globe with respect to the 1981-2010 climatology. | Month | PNG CSV Geojson |
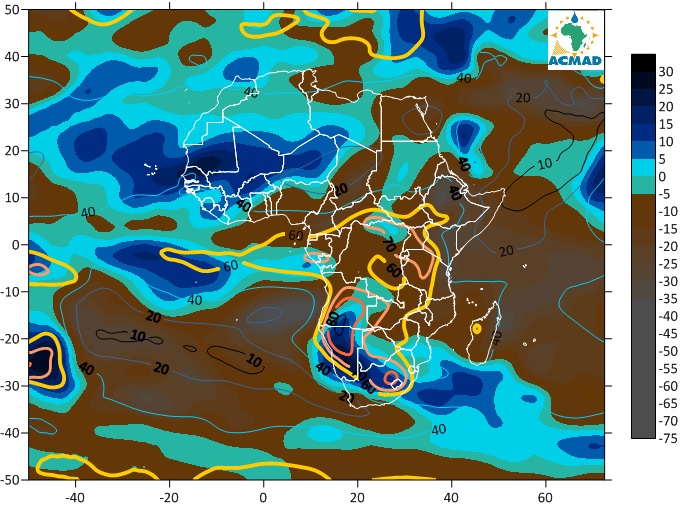
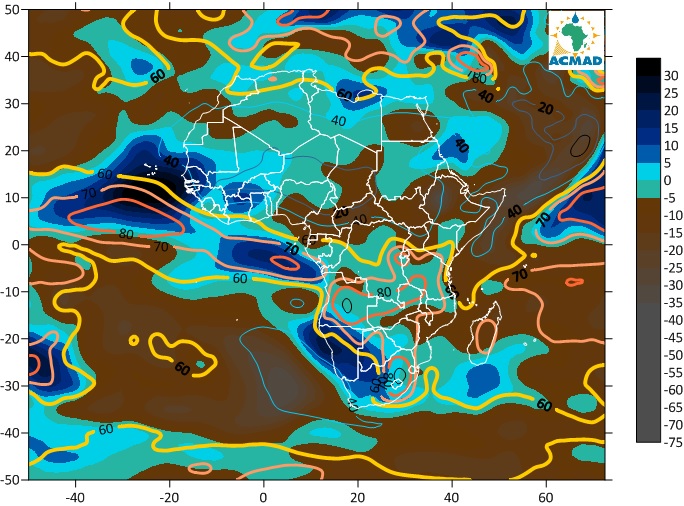
| Relative humidity and anomaly at 700 hPa | RHM700hPa | This is a contour map of monthly Relative Humidity and anomalies at 700 hPa for Africa with respect to the 1981-2010 climatology. | Month | PNG CSV Geojson |
| Relative humidity and anomaly at 850 hPa | RHM850hPa | This is a contour map of monthly Relative Humidity and anomalies at 850 hPa for Africa with respect to the 1981-2010 climatology. | Month | PPNG CSV Geojson |
| Wind anomaly at 850 hPa | WA | This product shows wind direction and anomaly at 850 hPa level. | Month | PNG CSV Geojson |
| Sea surface temperature map | SST Map | Monthly sea surface temperature anomalies are calculated with respect to the 1971-2000 climatology. | Month | PNG CSV Geojson |
| Plume of Model ENSO Prediction | Plume_ENSO | Forecasts by dynamical and statistical models over Niño 3.4 (5°N–5°S, 120°W–170°W) region. | Month | |
| Monthly precipitation in percent of average | Prec%_M | Total precipitation in percentage of average is based on the formula: P(%)= Total current precipitation/long term (1981-2010) average of precipitation X 100 | Month | |
| Seasonal precipitation in percent of average | Prec%_M | Total precipitation in percentage of average is based on the formula: P(%)= Total current precipitation/long term (1981-2010) average of precipitation X 100 | Month | PNG CSV Geojson |
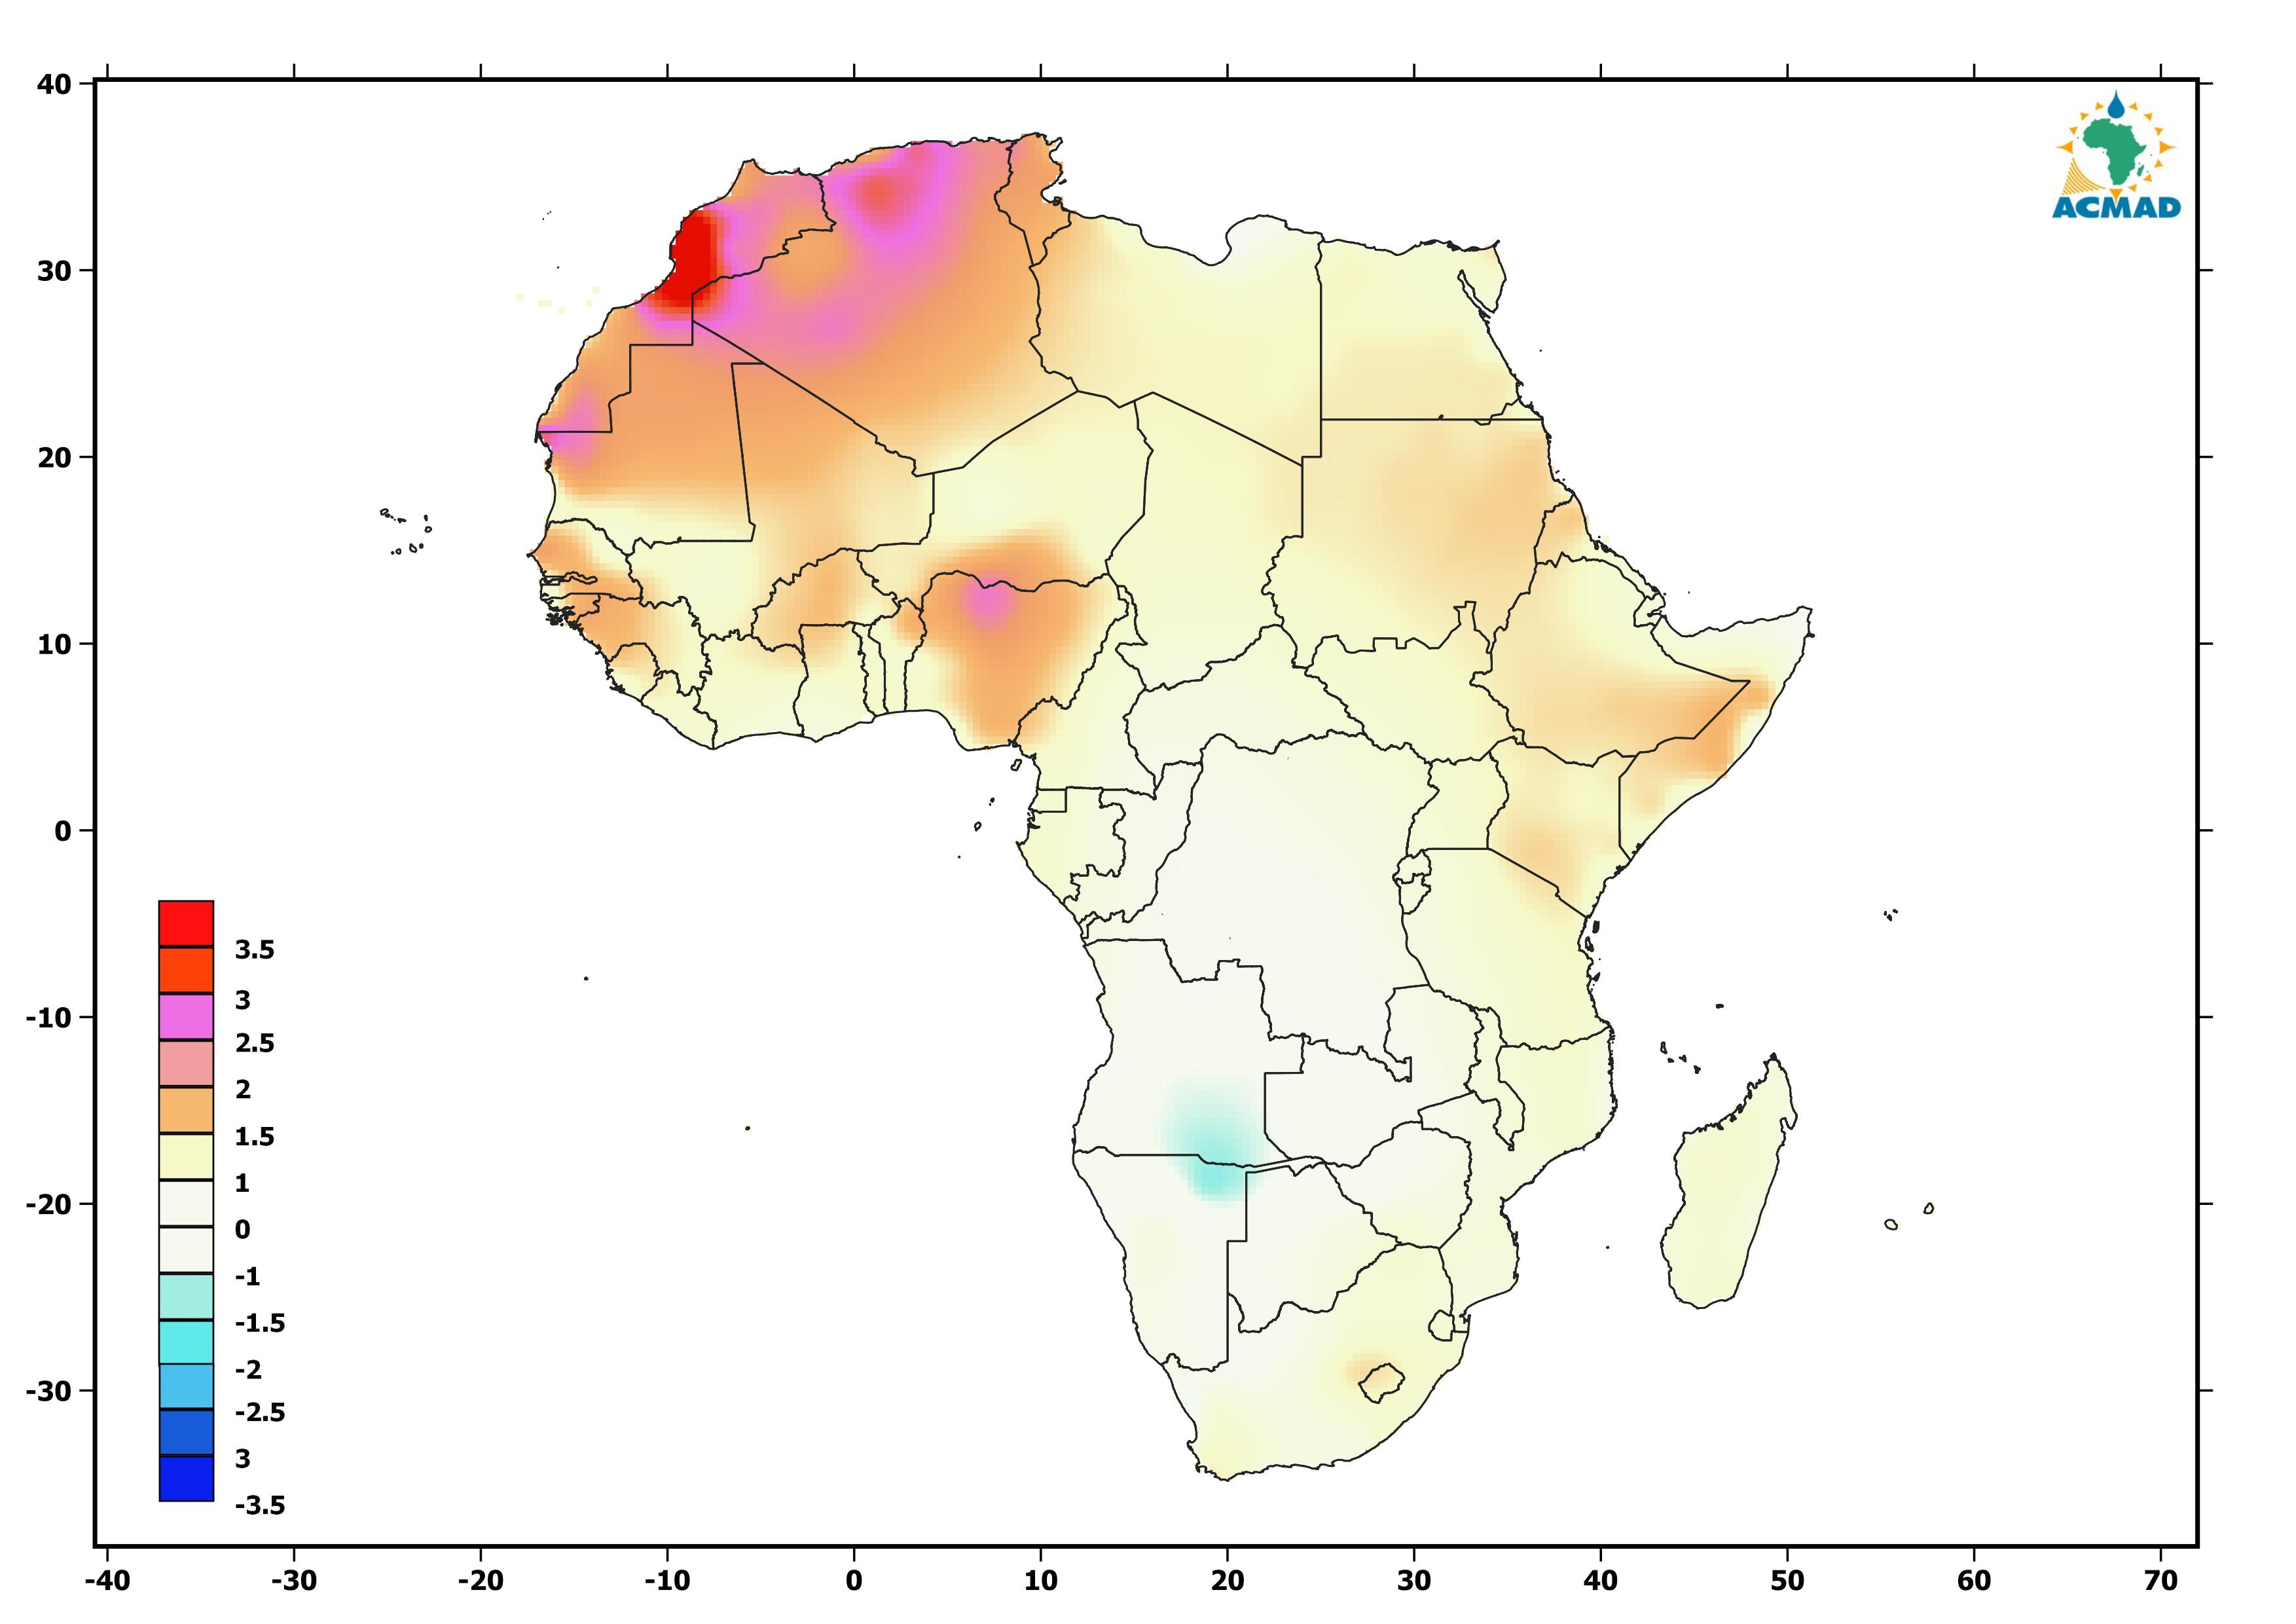
| Monthly Temperature Anomaly | MTA | Monthly temperature anomalies are calculated using estimated numerical data with respect to the 1971-2000 climatology | Month | PNG CSV Geojson |
| Seasonal Temperature Anomaly | STA | Monthly temperature anomalies are calculated using estimated numerical data with respect to the 1971-2000 climatology | Month | PNG CSV Geojson |
| Seasonal precipitation forecast | Prec_FC | A seasonal forecast therefore is a forecast of how the coming season is likely to be different from climatology in 3 categories Above, Near and Below normal | Seasonal | PNG CSV Geojson |
| Seasonal temperature forecast | Temp_FC | It is a forecast of how the coming season is likely to be different from climatology in 3 categories Above, Near and Below normal | Seasonal | PNG CSV Geojson |